![]()

By Ron Buck
Excel spreadsheets are ubiquitous and one of the most common tools used in banking. However, there are hidden costs associated with manual reporting with Excel spreadsheets. The hidden costs are associated with the valuable resources manually developing and distributing the spreadsheets, the inaccurate nature of spreadsheets and the poor utilization of spreadsheet reports.
This paper will define the problem, identify a solution to the problem and show the benefits (and ROI) of the solution.
The Problem
The primary problem is that Excel spreadsheets can cost an organization a lot of wasted time, resources and money.
Excel is spreadsheet software. It was never designed for reporting and it is not a complete reporting solution by itself. In fact, Excel is just one part of a manual reporting solution. The entire solution requires a design process of developing metric definitions (glossary); gathering and verifying data from multiple systems; building a data model that can support the application; constructing formulas, filters and pivot tables; user-support and data quality control; and distribution. Most banks have a lot of inefficient and unstructured processes that are part of the entire solution.
Manual reporting in Excel can introduce significant hidden costs into an organization. These hidden costs can have a significant impact on the bottom line by reducing productivity, causing late or bad decisions and wasting valuable resources. The problem is defined as follows:
- Many Hours of Wasted Resources Manual spreadsheet reporting involves manually gathering and verifying data from multiple disparate systems, manually constructing formulas, manually building charts and graphs and manually distributing the final spreadsheet to different colleagues in various groups. If these steps are not automated then employees are taking time to manually create, adjust, support, change, refine and share – a process that is error-prone, time consuming and expensive.
- Errors Due to Poorly Defined Standards and Simple Mistakes Manual spreadsheet reporting can be complicated by a lack of corporate standards that define metric definitions across the organization; centralized data access; and frequency. The lack of a data glossary and dictionary creates conflicts between reports. For example, the sales department may define application approval rate one way and underwriting has a different definition. Sales may define a loan based on the ‘committed’ amount of the loan while finance defines a loan based on the actual ‘funded’ amount of the loan. Within a bank, many groups use different formulas to reflect the same concept.
- Every Group Has a Spreadsheet Expert But what happens when that expert is out sick, on vacation, or (worse) leaves the bank?
- Duplication of Effort It is not uncommon for different groups within a bank to create very similar, even identical, manual spreadsheet reports. As already mentioned, this duplication of effort presents a risk of errors due to a lack of standards. Even more simply, though, this duplication of effort is a waste of resources. Most often this duplication of effort does not happen simultaneously. More likely, one person creates a spreadsheet for sales at a specific point in time. Then, months later, someone in underwriting needs a similar report and does not agree with the sales spreadsheet so they build a similar spreadsheet. About the same time someone in HR is developing an incentive program and builds a new spreadsheet. All three have most of the same data with different formulas for a different purpose. This common scenario results in a duplication of effort and conflicts over whose data is right.
- Loss of Confidence and Delayed Decisions Because Reports are Not Available at the Right Time Creating complex spreadsheets, especially when the input data has to be gathered manually from multiple systems (in multiple formats), can take a lot of time. Gathering and verifying the input data can be a very time-consuming task. The longer it takes to gather the data and create the spreadsheet manually, the longer it will be before they are available to the intended users. Manual spreadsheets reports are typically produced monthly or quarterly. In today’s competitive environment decisions are made in real-time. Delayed decisions can mean lost sales revenues and higher costs. These hidden costs of manual reporting in Excel are often overlooked by most organizations. Sometimes there is pressure to make a decision even when the data is not available in time. In these cases, managers often make their best guess or hastily gather input data without verifying it. A hastily created spreadsheet can contain countless formulaic errors as well. The results can be disastrous. A bad decision made because of bad data can cost the bank lost opportunities in the pipeline and sales revenues.
- Opportunity Costs – The Time Spent Fine-Tuning Spreadsheets Rather Than Analyzing and Understanding The Data Reports should be used to improve the bank’s performance. Users should be focused on what’s important instead of whose data is right.
Manual spreadsheet reports are error-prone, full of hidden costs, generally inconsistent and infrequent. Data errors erode management’s confidence to use them to make critical decisions.
. . . while it is incredibly easy to get started making spreadsheets, it’s also incredibly easy to make mistakes that cost banks millions of dollars . . .
The Solution – my Performance Navigator
my Performance Navigator delivers all the data needed to manage, coach and make critical decisions in ‘right-time’ on a single easy-to-use platform that can be used on a desktop PC, laptop, tablet or smart phone. my Performance Navigator automatically gathers data from multiple systems and automates all reporting.
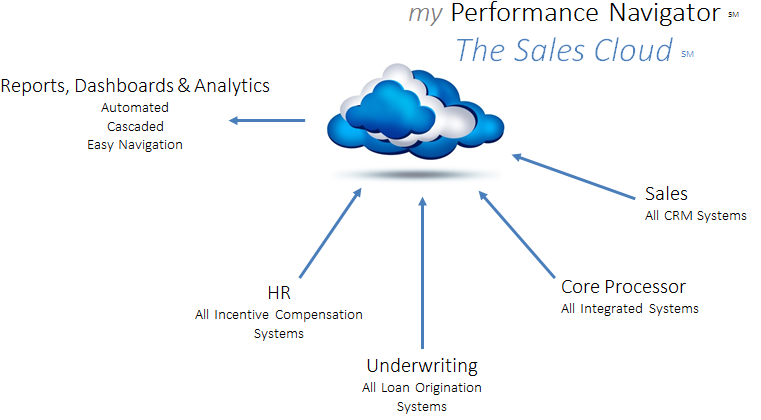
my Performance Navigator
my Performance Navigator is a cloud-based system (SaaS) that gathers data from any CRM system, core processor, loan origination system, incentive system and dozens of other systems and completely automates sales, underwriting, HR, finance and risk reporting, scorecards, visual dashboards and analytics.
my Performance Navigator is supported by a world-class group of data specialist that understand bank processes and the metrics that matter to sales, finance, underwriting and HR. This dedicated group provides customer support during all business hours – to provide data quality assurance, make report changes and support all user needs.
my Performance Navigator prints executive and board report packages along with interactive and cascaded reporting and analytics for every level of the organization – from a single source of the truth.
With a single click, or finger tap on any mobile device, users can drill down into the organization, change the time frame and navigate between reports, scorecards, dashboards and analytical tools.
All reports are customized for the unique needs of each customer – interactive ‘right-time’ reports designed to improve coaching, sales management, underwriting and sales processes, pipeline management and forecasting. my Performance Navigator options include:
- Loan Tracker Tracks loans from prospect to booking as it passes through each sales system (CRM, LOS, Core) and instantaneously alerts the sales person and customer of the loan’s status.
- Auto-Correct Reconciles data in each system and auto-corrects the data as it moves from system to system.
- Executive & Board Package (print PowerPoint) Visual dashboards of graphs, charts and trending lines delivered in a printed PowerPoint deck.
- Print Functionality Various modes of printing.
- Tools for the Sales Coach Embedded calculators, ‘what-if’ scenario planning tools and automated action planning.
- Training my Performance Navigator training is integrated with existing sales training programs.
. . . my Performance Navigator can be installed quickly for a price that is, generally, less than the cost of existing resources manually producing spreadsheet reports . . .
The Benefits of the Solution
- Cost Benefits my Performance Navigator can be installed quickly for a price that is, generally, less than the cost of existing resources manually producing spreadsheet reports (the initial investment is immediately off-set by cost-savings).
- Performance Benefits When designed with the Metrics that Matter and integrated with training for the coach, my Performance Navigator helps generate a 5% increase in sales revenue in the first year (minimum).
- Efficiency Ratio The combination of reducing the cost of spreadsheets, reallocating resources, and improving performance will typically result in a 10 percentage point improvement of the efficiency ratio in the first year.
- ROI my Performance Navigator is installed with a goal to generate at least 200% to 400% ROI (assuming a ROA of 1%) over first three years of initiative (and break-even in the first year of installation).
- Intangible Benefits
- Smarter, more confident management decisions.
- An improved organization anchored on trusted data from the frontline to the board room across every group in the bank.
- More time to focus on what’s important and less time spent arguing who’s right.
- A dedicated full-time team focused on data quality assurance, process improvement, and customer service (changes, updates and new reports).
- Improved forecasting, pipeline management and processes.
- Anywhere, anytime access to critical reports.
- No software or hardware to purchase.
- Complete sales cycle visibility and reconciliation across all systems and departments within the bank.
- Protection for training and incentive investments.
- Reallocation of resources and budgets to more important initiatives.
Next Steps
If you are interested in knowing more, seeing a demo of my Performance Navigator or getting a free (no obligation) assessment of your current spreadsheets and how my Performance Navigator can save you money, improve your coaching, sustaining your sales training and ultimately improving sales performance contact Ron Buck at:
- 480-212-6082
- rbuck@smandh.com